Instant IELTS grammar practice for teachers & learners
1. For teachers
(See bottom of this page for learner on-line practice.)
(See bottom of this page for learner on-line practice.)
|
IELTS Writing Task 1
Bar Chart #1 Complete the sample answer by circling the correct words.
Answer Key on Page 2 |
2. For learners
Look at the Bar Chart and then read the sample answer below (190 words). Then choose the best words to complete the sentences.
Look at the Bar Chart and then read the sample answer below (190 words). Then choose the best words to complete the sentences.
|
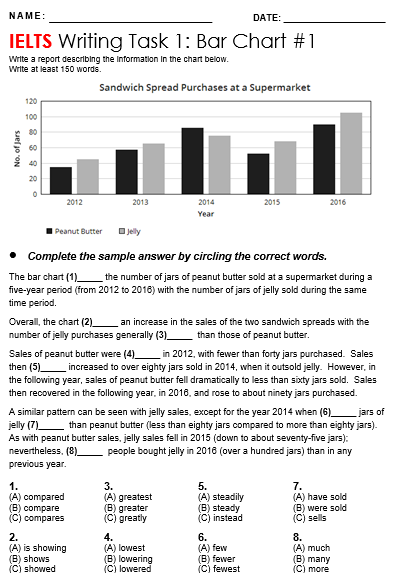
The bar chart (1)_____ the number of jars of peanut butter sold at a supermarket during a five-year period (from 2012 to 2016) with the number of jars of jelly sold during the same time period.
Overall, the chart (2)_____ an increase in the sales of the two sandwich spreads with the number of jelly purchases generally (3)_____ than those of peanut butter. Sales of peanut butter were (4)_____ in 2012, with fewer than forty jars purchased. Sales then (5)_____ increased to over eighty jars sold in 2014, when it outsold jelly. However, in the following year, sales of peanut butter fell dramatically to less than sixty jars sold. Sales then recovered in the following year, in 2016, and rose to about ninety jars purchased. A similar pattern can be seen with jelly sales, except for the year 2014 when (6)_____ jars of jelly (7)_____ than peanut butter (less than eighty jars compared to more than eighty jars). As with peanut butter sales, jelly sales fell in 2015 (down to about seventy-five jars); nevertheless, (8)_____ people bought jelly in 2016 (over a hundred jars) than in any previous year. |
|


